GammaSight
// Real-Time Options Flow Dashboard for Futures Traders
What Options Flow Actually Tells You: From CME Snapshots to a Live Trading Dashboard
Every futures price carries a shadow. Underneath the candle you see on a chart sits an entire options market - dealers hedging, funds rolling positions, retail buying cheap upside - and that activity leaves fingerprints long before they show up in the tape.
The question behind this project was simple to state and hard to answer: can you read those fingerprints in something close to real time, and turn them into a tool a discretionary trader can actually use while sitting in front of a chart?
The raw material was a stream of options snapshots pulled every five seconds straight out of SierraChart, full chains, strikes, bids and asks, open interest, all of it. No black box, no vendor feed abstracting the data away. Just raw quotes that had to be turned into implied vol, into positioning, into something a human could glance at and trust.
What follows is the record of that process: the concepts that had to be built from scratch, the ideas that looked promising and died anyway, and the ones that survived long enough to end up wired into a dashboard that runs live today.
Building a vocabulary before building anything else
Before testing a single hypothesis, the data needed a vocabulary.
The first serious study in the project - the one everything else quietly depends on is a slow, deliberate rebuild of options math from the ground up: finding the true at-the-money strike through forward put-call parity rather than trusting a quoted forward, solving for implied volatility with Black-76, then stacking derived quantities on top.
Two of those quantities carry the whole project.
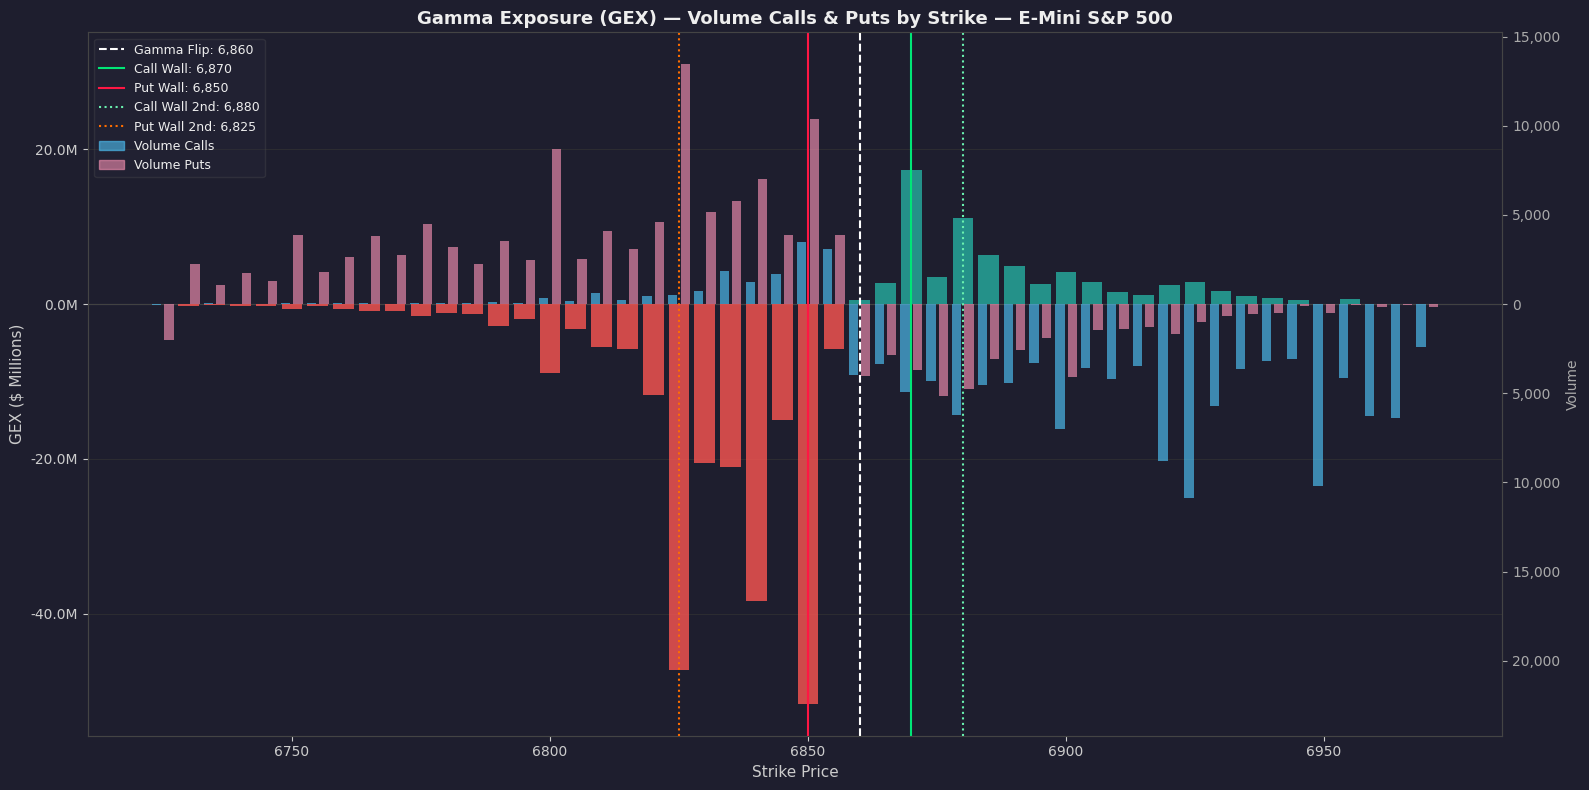
- Gamma exposure (GEX):
- Delta exposure (DEX):
The first honest test... and it said no
With the vocabulary built, the obvious next move was to ask the blunt question: do any of these metrics predict where price goes next?
A dedicated study ran the test properly - correlations, rolling correlations, a Random Forest fed with the derived indicators, everything checked against price moves five to sixty seconds out.
The answer, written directly into the results rather than left implicit, was no.
Five-second changes in GEX, DEX or skew do not forecast direction over the following minute.
A "confluence score" built from these signals turned out to describe what was already happening, not what was about to happen. It's a contemporaneous read of positioning, not a leading one and that distinction reshaped everything that came after it.
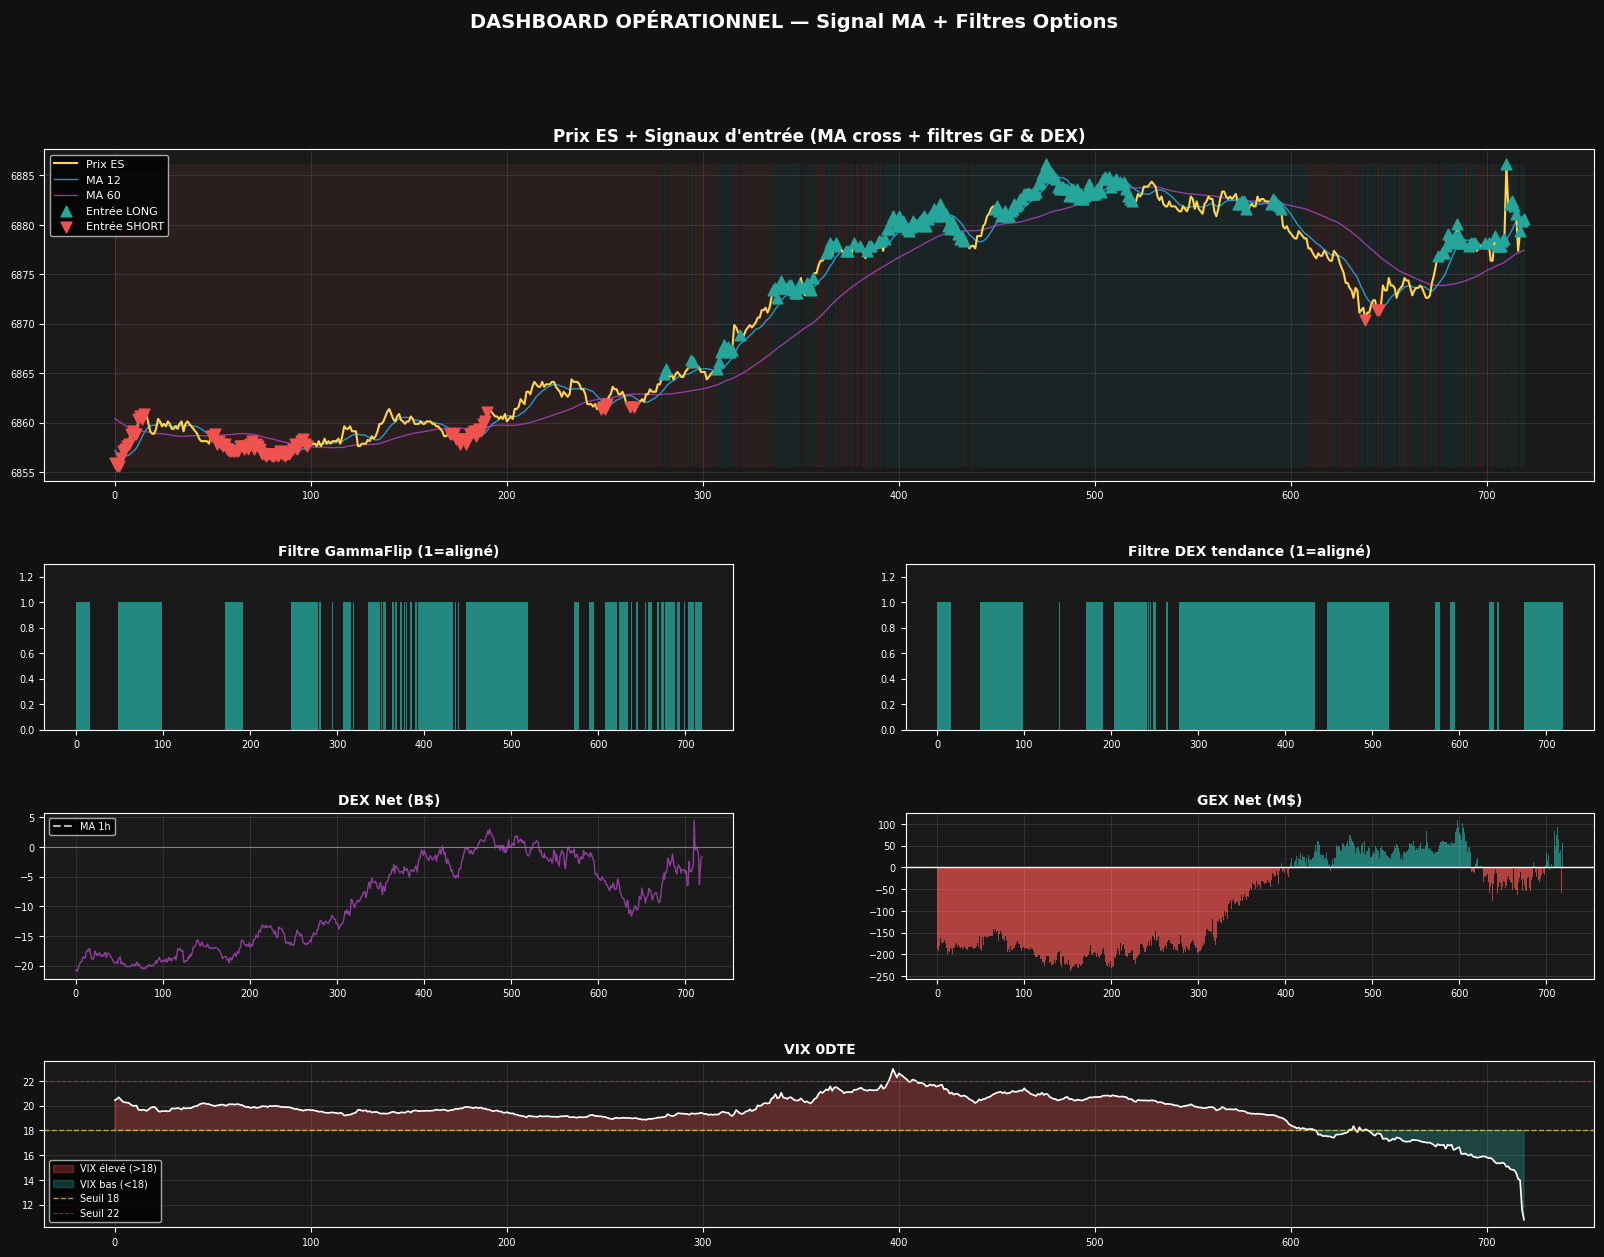
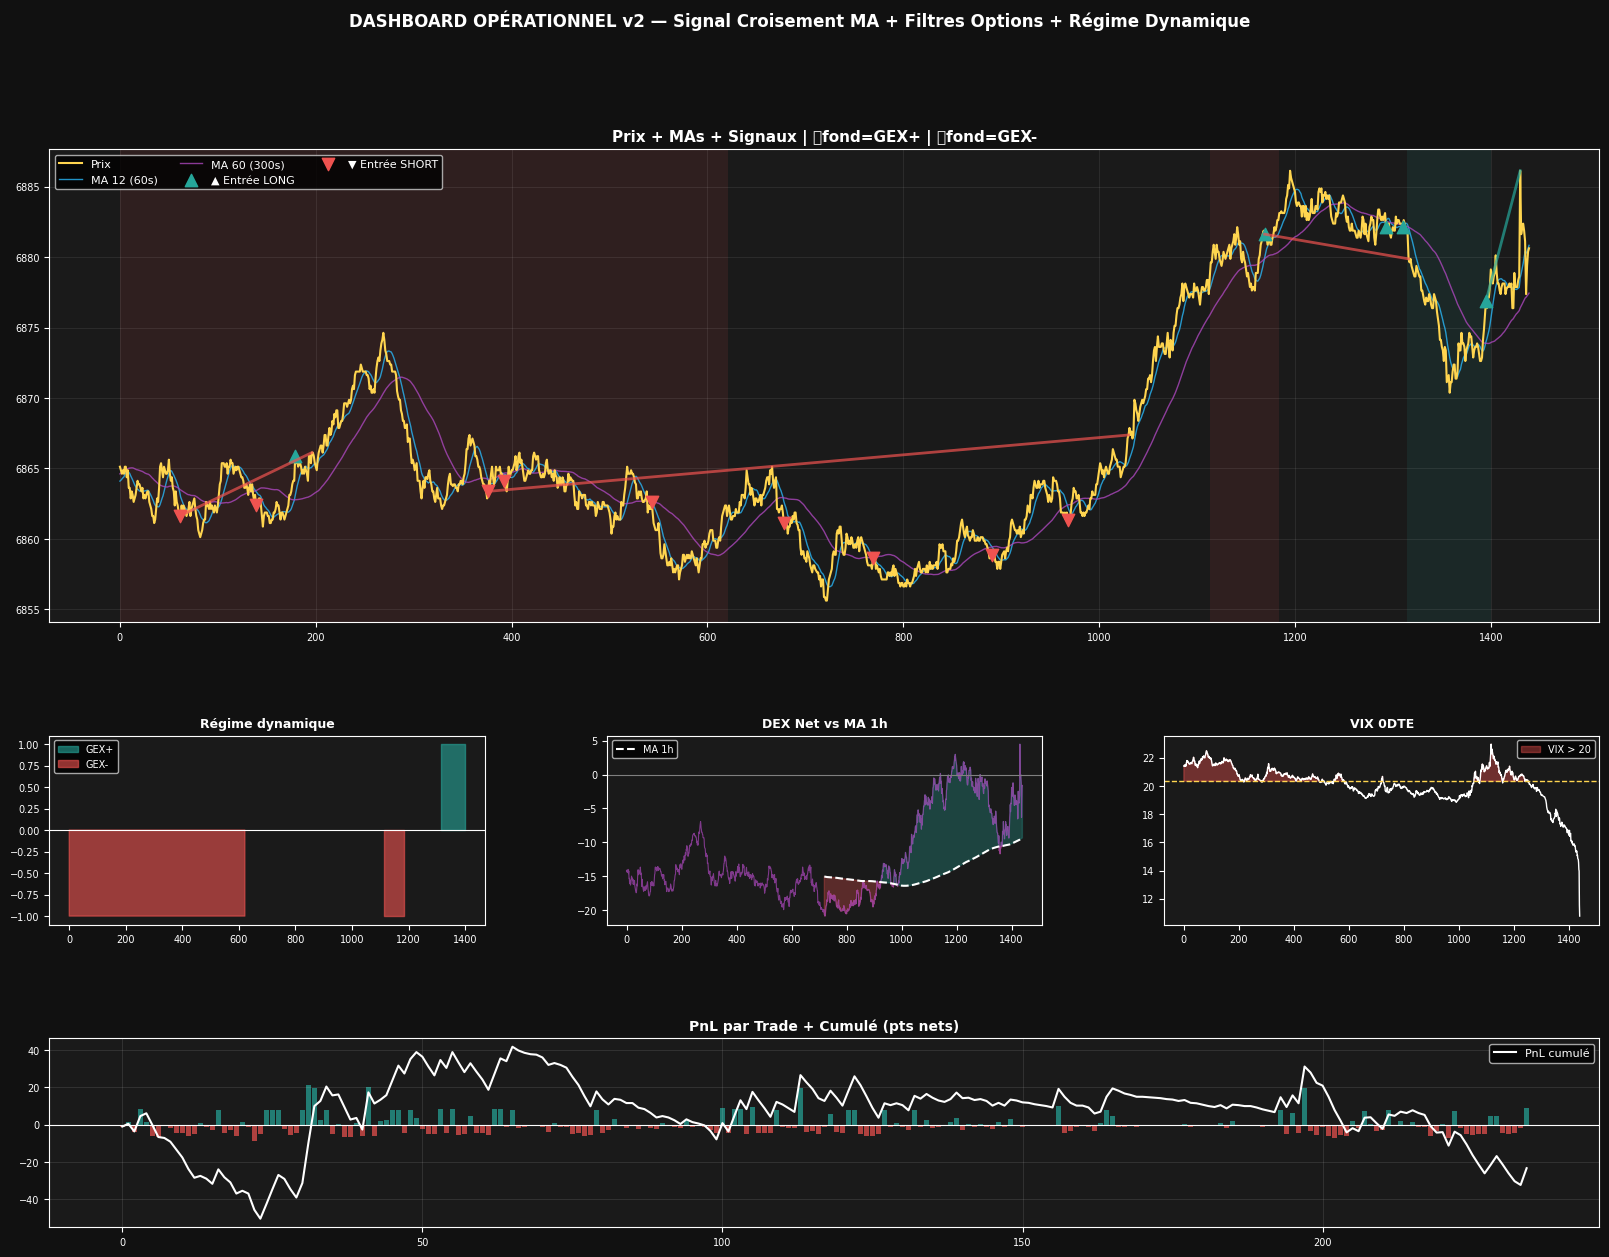
What saved the line of research was a narrower, less ambitious claim. Instead of asking the indicators to predict price, the follow-up tested whether they could filter an existing simple signal (a 12/60 moving-average crossover) so it only fired inside favorable gamma regimes with delta exposure confirming direction.
Run across the available sample, that filtered version came back with roughly +0.42 points of expectancy per trade and a 52.4% win rate over close to twenty thousand observations.
Modest numbers, and no one should mistake them for an edge that prints money. But the structural insight underneath them - treat options metrics as a regime filter, not a standalone forecast became the load-bearing idea for the rest of the project.
Adding context: where price is, not just what the options say
If options metrics work best as a filter, the next logical step was building better context for what they're filtering.
A follow-up study added level-awareness: how many times has price already tested a given strike today, how fast did it approach, is this the first touch of a call wall or the fourth. The pattern that emerged was intuitive once it was measured, a first test of a level carried a positive expectancy near +1.30 points, while a third-or-later test of the same level flipped to roughly -0.97. Levels wear out.
A fast, spike-like approach into a call wall also behaved differently from a slow grind into the same strike, by a wide enough margin to matter.
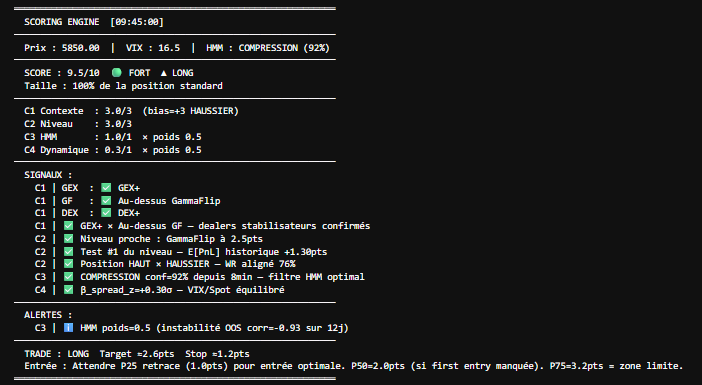
That same study also reached further than it probably should have. It layered in a Hidden Markov Model to infer latent volatility regimes and a beta/CUSUM tracker on the VIX-to-spot relationship, then rolled everything - level context, HMM regime, VIX tension, the earlier GEX/DEX filter - into a four-layer composite score.
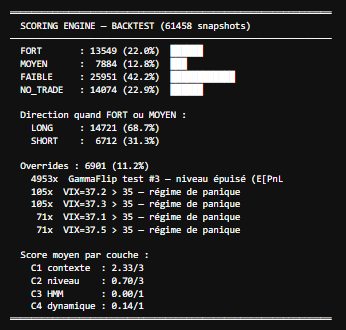
The HMM component didn't hold up: out-of-sample behavior was unstable enough (a correlation swing to roughly -0.93 against expectations) that its weight in the final score was cut in half rather than trusted outright. That composite scoring engine was later pulled out into its own module, 'scoring_engine.py', fully built and documented and it never made it into the production dashboard. It sits in the repo today as a research artifact, a more ambitious model than what actually ships, kept because the ideas in it (particularly the override rules block entries after a third gamma-flip test, stand down when VIX prints above 35) are worth revisiting once there's more data to trust the regime layer with.
Run once against roughly twelve days of data, the engine flagged a strong or medium setup only about a third of the time (the rest split between "faible" and outright no-trade), and its own average layer scores told the same story as the correlation check above: the HMM layer averaged 0.00 out of 1 across the whole sample, contributing essentially nothing in practice, while the gamma-flip override alone fired close to five thousand times.
The engine wasn't wrong to be selective, it just leaned on the layer that never proved out.
The hunt for the oracle strike
If there was one idea in this whole project worth chasing hard, it was this one: options markets price in a distribution of where the underlying will land.
A straddle's price at a given strike reflects the market's expected range. So could you, from the shape and evolution of straddle prices across strikes, back out the strike that would end up marking the day's high or low - the "oracle strike" - before the session actually got there?
The study built to test this threw a genuinely serious toolkit at the problem.
- DBSCAN clustering to find where straddle-implied levels converged across time.
- KDE ridge estimation to track how the probability mass shifted strike to strike as the day progressed.
- XGBoost model trained to see if it could pick up nonlinear structure the simpler approaches missed. Cross-checks against GEX and DEX wall locations, on the theory that dealer positioning might reinforce whatever the straddle shape was implying.
The study's own conclusion is blunt about it, and worth quoting directly because it's a rare thing to see written plainly in a research writeup rather than dressed up: "None of the tested approaches predicts the oracle strike systematically… this is not a method problem - it's a fundamental limitation of the data."
Not "needs more tuning."
Not "promising but early."
A limitation of what a five-second options snapshot can actually tell you about a single day's terminal range, full stop.
The DBSCAN clustering piece is worth walking through, because it produces a chart that looks like evidence right up until you check what it's actually counting. Round every straddle bound to the nearest two points, bin by minute, count how many strikes pile onto the same level, and plot it as a heatmap with price traced over the top. The colour piles up right along the price line for the entire session, as if the market kept rebuilding a convergence zone exactly where price already sat. Read it for more than a few seconds and the causation runs backward: strikes near the money are always the ones with the tightest, most heavily quoted straddles, so the heaviest concentration was always going to sit under wherever price happened to be.
That's clustering that tracks price, not clustering that leads it ! The opposite of what an oracle-strike signal would need to do to be worth anything.
There was a smaller result worth keeping from the wreckage - a classifier that could distinguish a "priced" session (range roughly known early) from one "in discovery" (still searching for its range) at close to 80% accuracy.
But it was built on only fifteen days of data, and the writeup flags that sample size honestly rather than dressing the number up as more than it is. Call it suggestive, not usable.
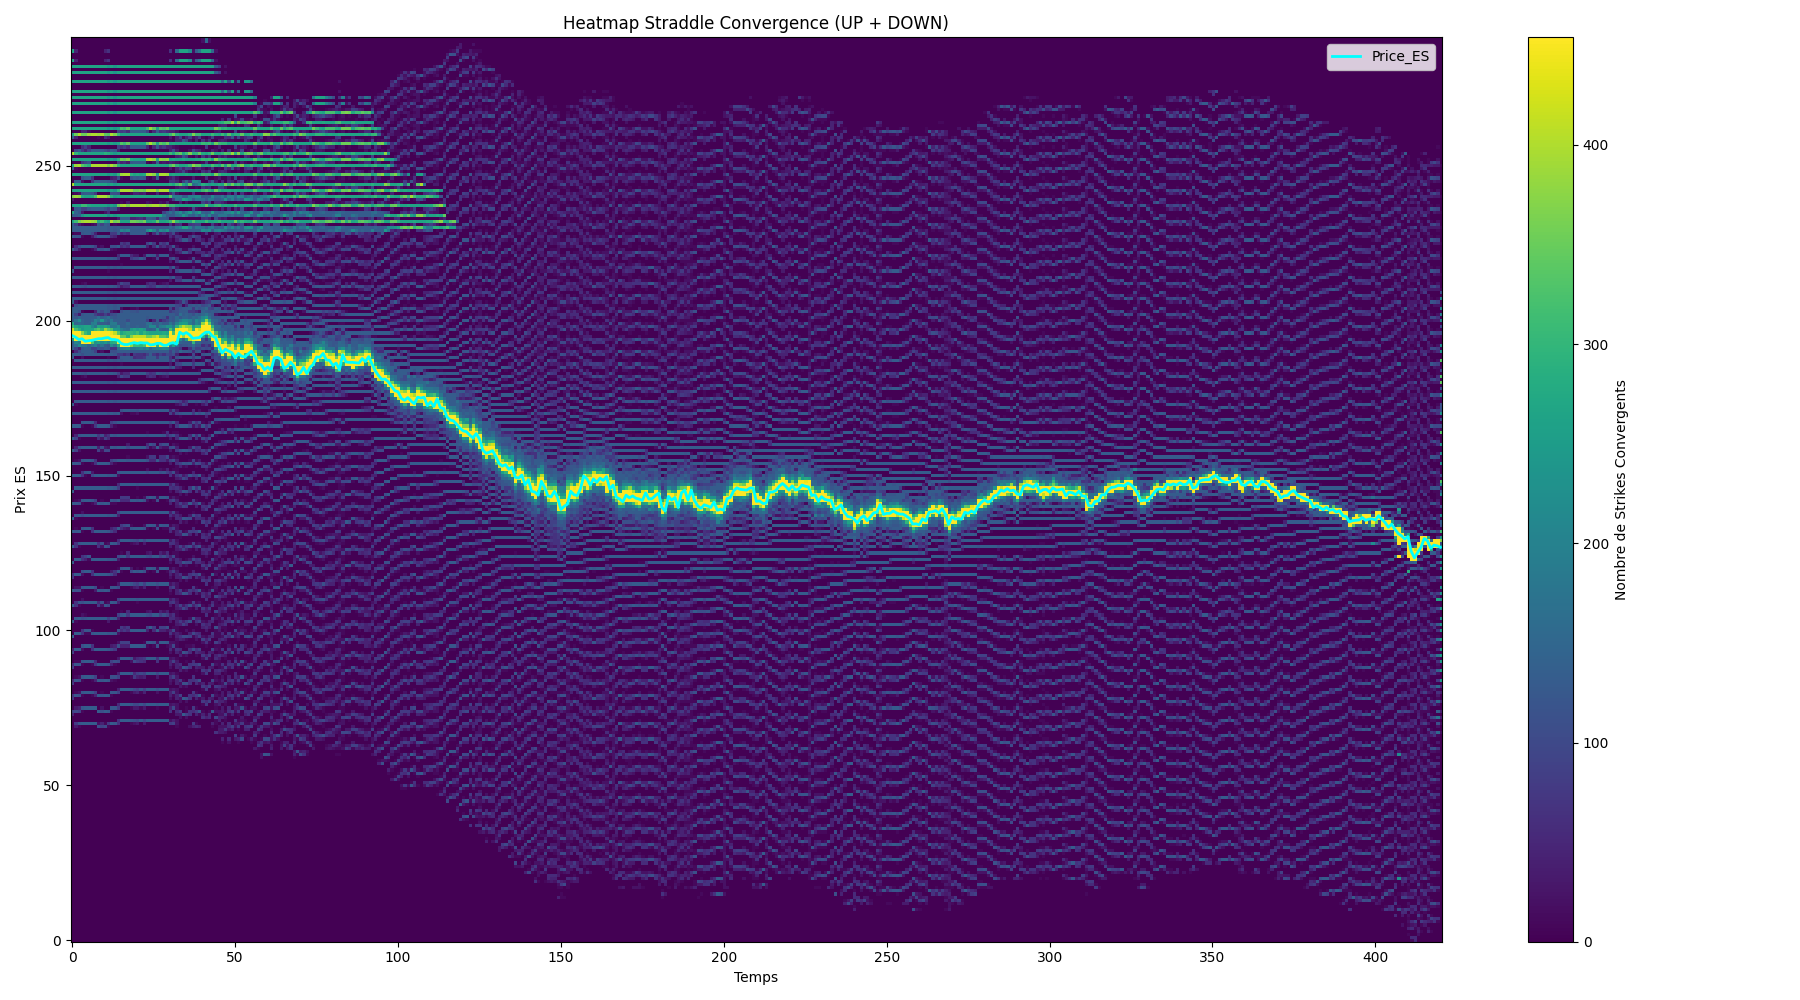
The faint horizontal band sitting well above the price track in the first fifth of the session is a data artifact, not a second convergence zone.
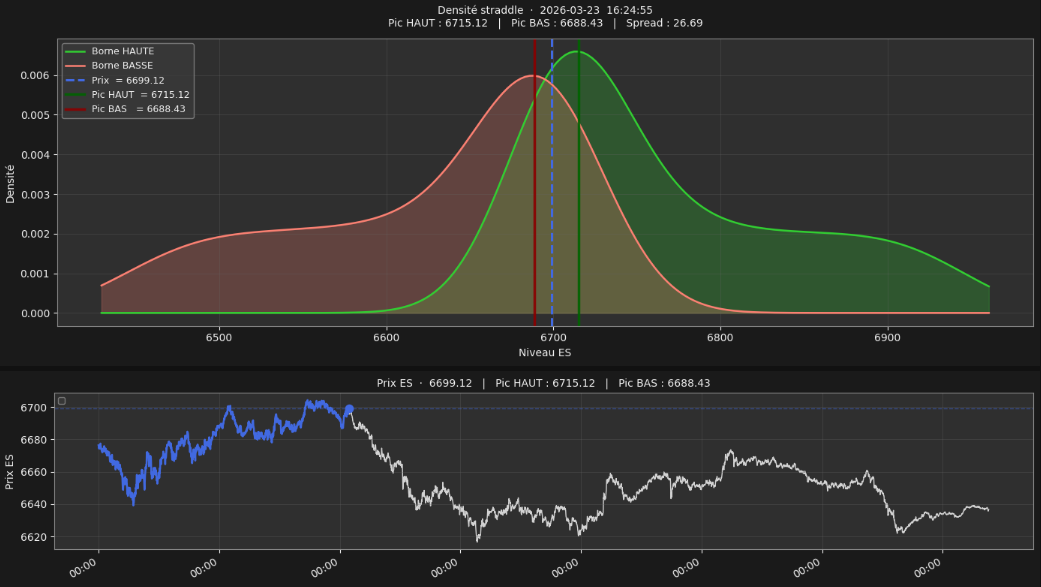
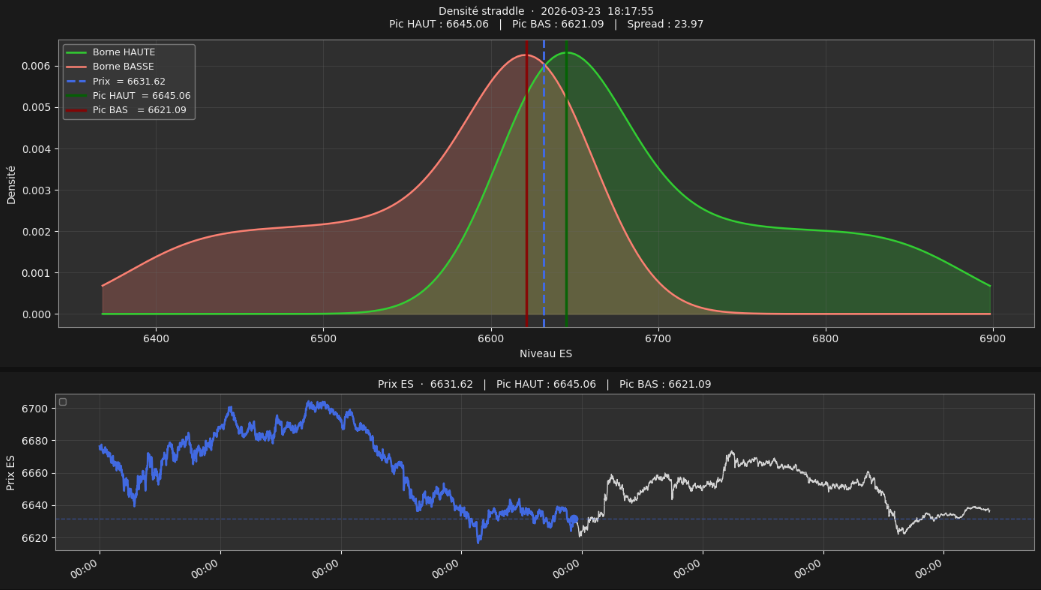
A narrower cut of the same instinct went a different route: instead of clustering strikes, turn the straddle prices at each snapshot into a kernel density estimate, one hump for the UP leg and one for the DOWN leg. Run across enough snapshots, the lower hump carried more mass than the upper one more often than not; price leaning toward the weaker bound rather than splitting evenly between the two.
That asymmetry became a standalone entry signal: spikes in straddle-density on the downside, traded on their own. It produced 35 trades total, a 45.7% win rate, and a confidence interval wide enough (±16%) that I calls the result "statistically fragile" and asks for at least 200 trades before drawing any conclusion either way.
That one isn't rejected, exactly. It's suspended, waiting on a sample size the current data collection hasn't produced yet.
Other doors opened and quietly closed
Not every dead end deserves its own section, but several are worth a line each, because together they show the shape of what didn't work rather than just the two headline failures above.
- A blended GEX/DEX "anchor" price - weighting gamma exposure at 75% and delta exposure at 25% to produce a single reference level - looked reasonable on paper, but the normalization attempts needed to make it stable across different volatility regimes were abandoned mid-test, commented out and left that way.
- A separate look at VIX Call and Put spreads got as far as sketching the idea and labeling it as a "concept" - untested, no verdict either way.
- A family of six parallel trials each applied the same mean-reversion-crossing detector to a different metric (delta exposure, gamma exposure, VIX, VIX calls, VIX puts, call-vs-put delta exposure), and got consolidated into a single multi-panel view - but nothing from that family made it further than the consolidation step.
- A notional call/put spread tracker had a "speed" metric half-built into it before being commented out.
- A price/GEX slope-divergence detector never reached a stated conclusion in either direction.
- And a bid/ask spread utility for the strikes around ATM turned out to be exactly that - a liquidity sanity-check tool, not a signal, and was never meant to be one.
None of these are failures in the dramatic sense. They're what a real research process looks like once you stop cherry-picking the results that worked.
What actually survived: flow, confluence, and one very deliberate chart
Two threads made it all the way to production.
- The first is a direct, net measure of institutional-style order flow at each strike - internally called HIRO - tracked as a rolling z-score of its own rate of change. A grid search across window lengths and threshold multipliers, checked against forward returns at 15, 30 and 60 minutes, found a specific combination that held up meaningfully better than the untuned default.
That signal, on its own, wasn't enough. What made it useful was combining it with parallel z-score signals on IOI volume, VIX, GEX and DEX shifts, and ATM skew - and requiring two or more of them to agree before calling it a real event.
That confluence logic, plus a clustering system to stop the same underlying move from re-triggering five times in a row, is the direct ancestor of the signal engine running in the dashboard today. - The second thread is a chart rather than a signal, and it might be the most carefully designed piece of visual work in the whole repo. Net order-intent flow at each strike, plotted as a heatmap, encoded not with a simple diverging color scale but with hue for direction and luminosity for volume - so a lit-up green zone reads immediately as a magnet, a lit-up red zone as resistance, and quiet strikes fade into the background rather than competing for attention.
- A third idea worth naming: converting the VIX print directly into expected-move points around price - sigma as a function of implied vol, spot, and time to expiry - to draw dynamic bands rather than static ones. That band logic didn't stay a one-off chart. It got generalized and folded into how the dashboard frames price context today.
-
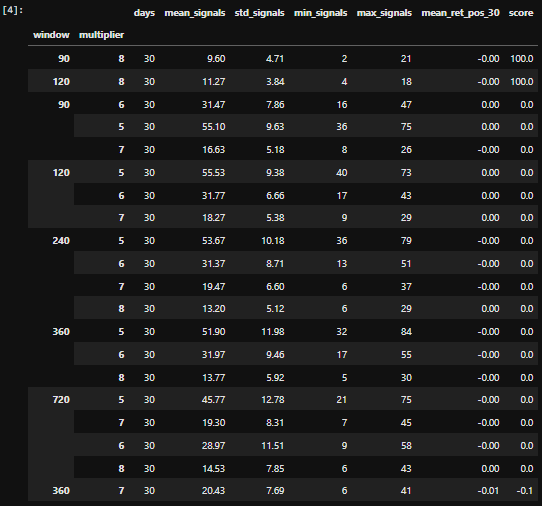
HIRO parameter grid-search summary table -
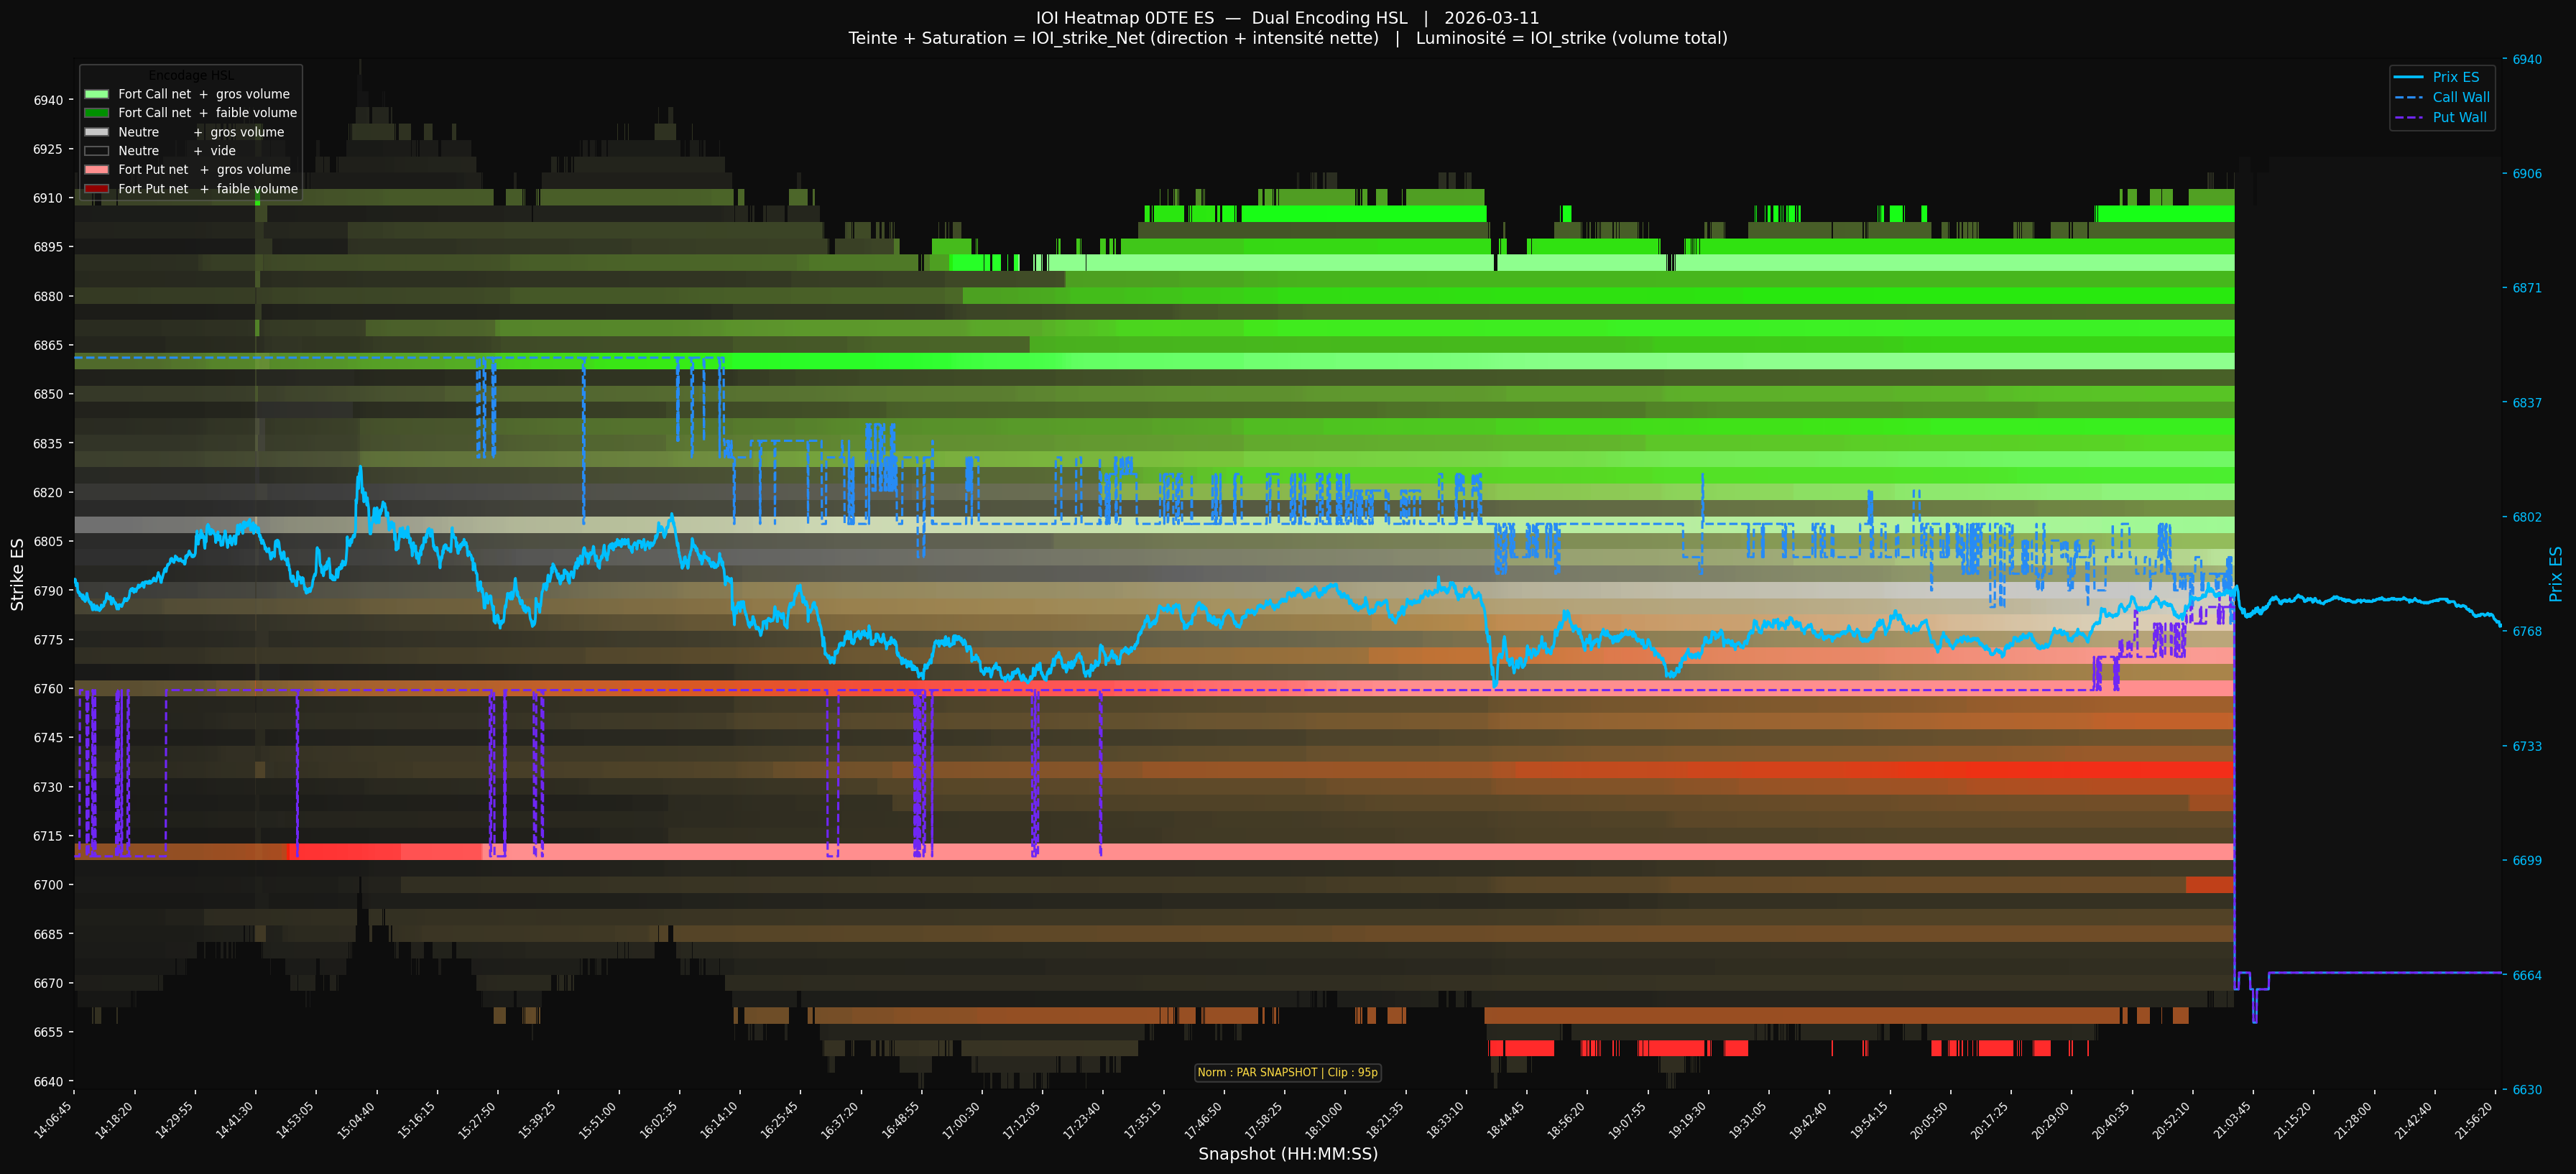
Dual-encoding HSL Heatmap -
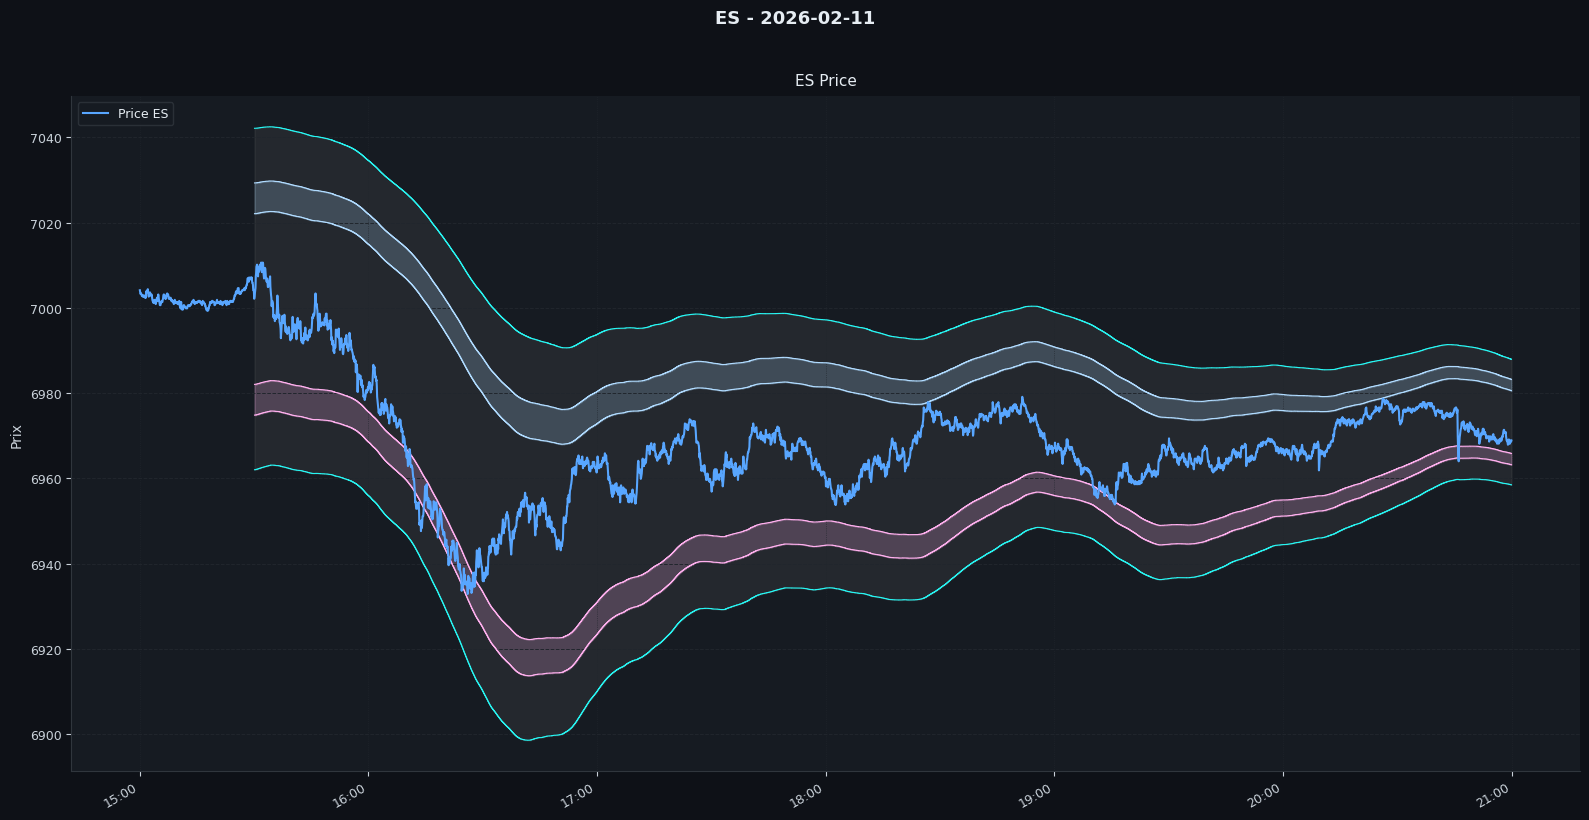
VIX Expected-move band chart
From research to production
Getting from "this works as a one-off test" to "this can run unattended against live data" needed its own pass.
One piece of work exists purely to ground-truth the math - checking implied vol, VIX, GEX, DEX and skew formulas cell by cell against reference values computed independently in a spreadsheet, so that nothing downstream inherits a silent formula bug. Only once those numbers matched did the same logic get rebuilt as a 'watchdog'-based handler that watches SierraChart's snapshot folder directly, computes the full metric set on each new file, and writes it straight to the CSV the dashboard reads.
The pipeline itself went through several working versions rather than being written once.
Constants that started out hardcoded got pulled into config files. Kernel-density estimation was added to model price clustering. A "light" variant was split off from the full version, trading some detail for lower latency. Straddle metrics, HIRO flow, a max-pain calculation and a JSON snapshot export all landed in a later pass, followed by a rewrite of the implied-vol solver - replacing a per-row root-finder with a vectorized version - purely for speed.
The last major fork split the pipeline into two modes that run side by side rather than one replacing the other: a same-day-expiry mode and a consolidated mode that aggregates across every listed expiry at once, weighting each by time to expiry. Both modes share the same signal logic; they just look at a different slice of the option chain.
The dashboard, end to end
What actually runs today looks like this.
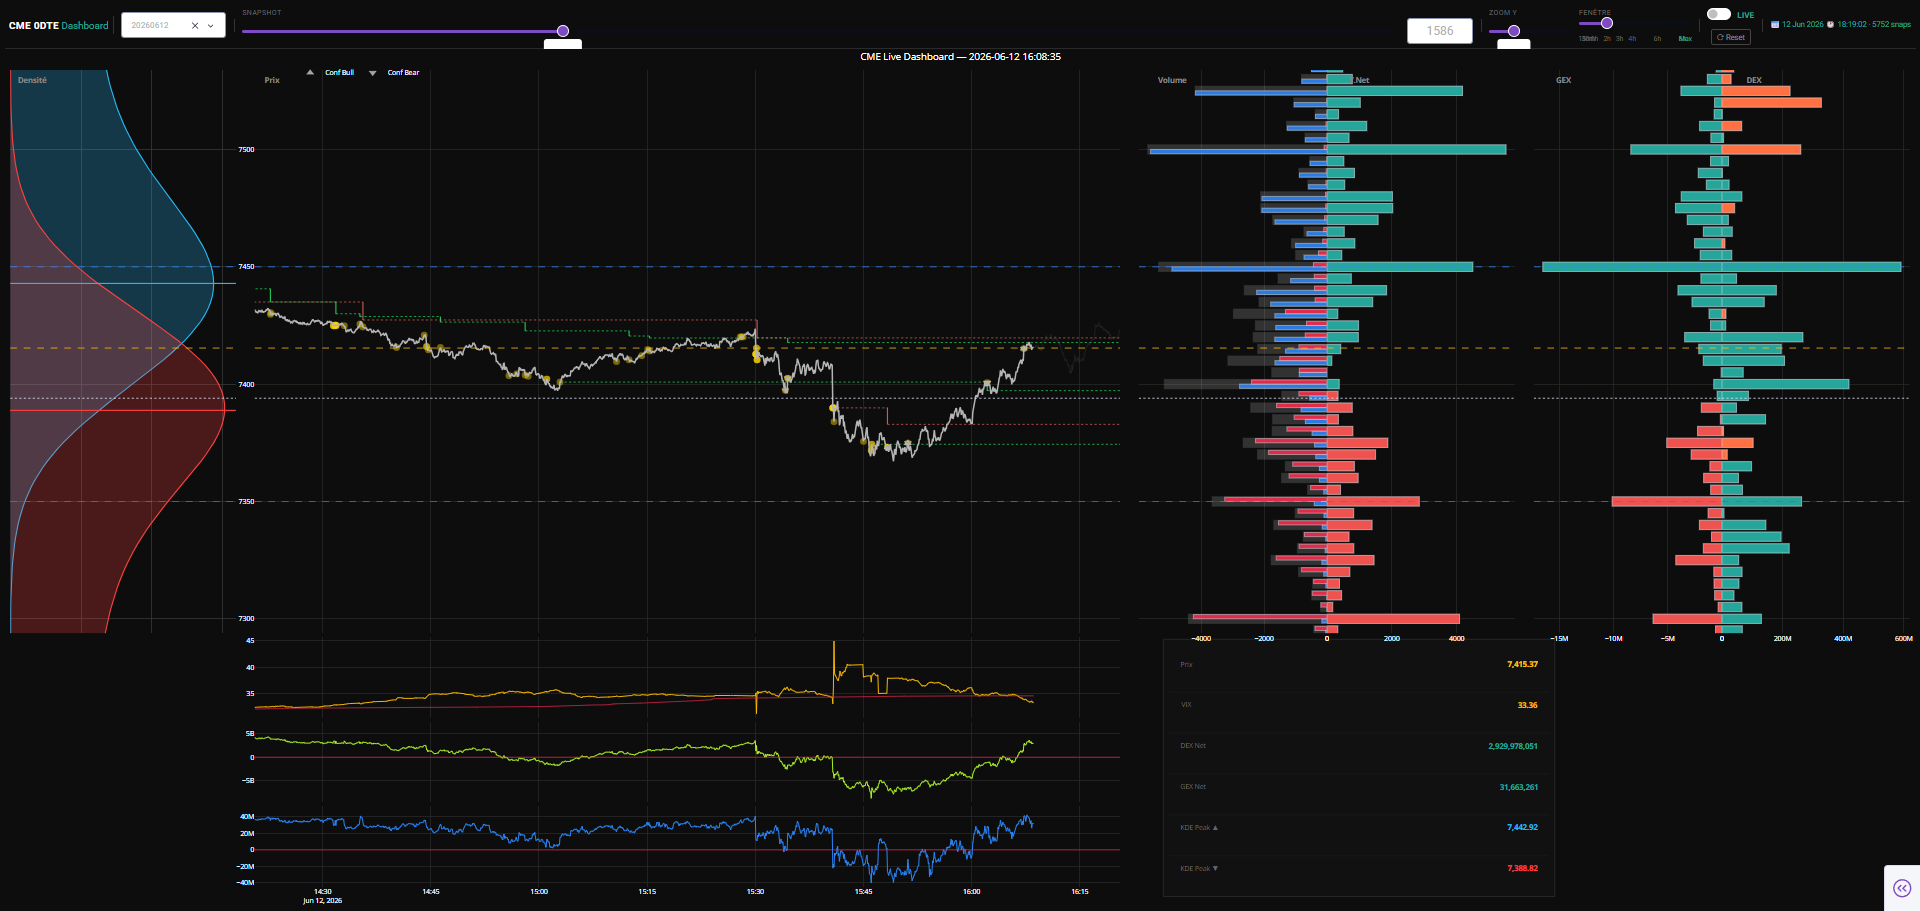
SierraChart drops a snapshot file every five seconds. A watcher process picks it up the moment it's written, computes implied vol, GEX, DEX, VIX-style variance, skew and straddle density, and appends the result to a running CSV - plus a companion file holding the KDE grid for the density panel.
A separate module reads that stream and computes the live signals: z-scored shifts in flow, volume, VIX, GEX, DEX and skew, checked for persistence and rolled into a confluence score whenever enough of them agree.
Everything gets rendered in a Plotly dashboard with panels for the straddle-density distribution, price with signal markers overlaid, VIX, DEX, GEX, and per-strike order-flow profiles - switchable between the same-day and consolidated modes depending on what the trader wants to watch. An earlier version pushed updates to a browser over server-sent events from a plain HTTP server; that approach worked but got replaced once the Plotly app could do the same job with proper interactivity built in.
The alerts a trader actually sees are concrete, not abstract scores: a flow spike at a specific strike, a VIX jump outside its recent range, a shift in dealer gamma or delta positioning large enough to matter, a skew move suggesting hedging pressure building on one side, and - the one that matters most - a confluence flag when two or more of those line up in the same place at the same time.
Where this leaves things
The honest summary of this project isn't "options flow predicts price." It's narrower and more useful than that: options positioning is a real, measurable regime signal !
It tells you whether the ground underneath price is likely to hold or give way - but it is not, on its own, a crystal ball for where price is headed next, and every attempt to push it into that second job came back with the same answer.
The oracle-strike hunt made that point most clearly, and made it honestly, rather than quietly dropping the question and pretending it was never asked.
What's live now reflects that lesson: a filter, not a forecaster, wrapped around flow and confluence rather than a single indicator.
The four-layer scoring engine with its regime and override logic is still sitting in the repo, unused, waiting for enough data to trust its regime component the way the simpler pieces have already earned that trust. That's the next thread to pull.
Duration
2026 - Present
Tech Stacks
- Python
- Options Math
- Dash
- Plotly
Team
- Renaud Robert
- Terence Dumartin